Top 5 Sysadmin Tools
Thursday March 29, 2018
During day-to-day server administration, there are a variety of important system metrics to analyze in order to assess the performance of the server, as well as diagnose any issues. A few of the most important metrics from a hardware standpoint for a system administrator to monitor are CPU usage, memory usage, disk I\O. Log data from applications themselves can be equally important when it comes to diagnosing problems with specific programs or websites running on a server.
With that in mind, I am outlining some basic tools I use as a system administrator which are either commonly bundled with Linux distributions, or easily installable from software repositories, and can greatly aid in diagnosing server issues or checking up on the health of the server day to day.
1. atop
If you are a Linux administrator or a system administrator familiar with the command line, you have probably heard of the “top” utility for monitoring system resources and running programs. It is similar to the Task Manager utility on a Windows system.
Atop is a utility similar to top which provides a more detailed look into important server metrics, it can be an even more helpful tool for identifying performance issues.
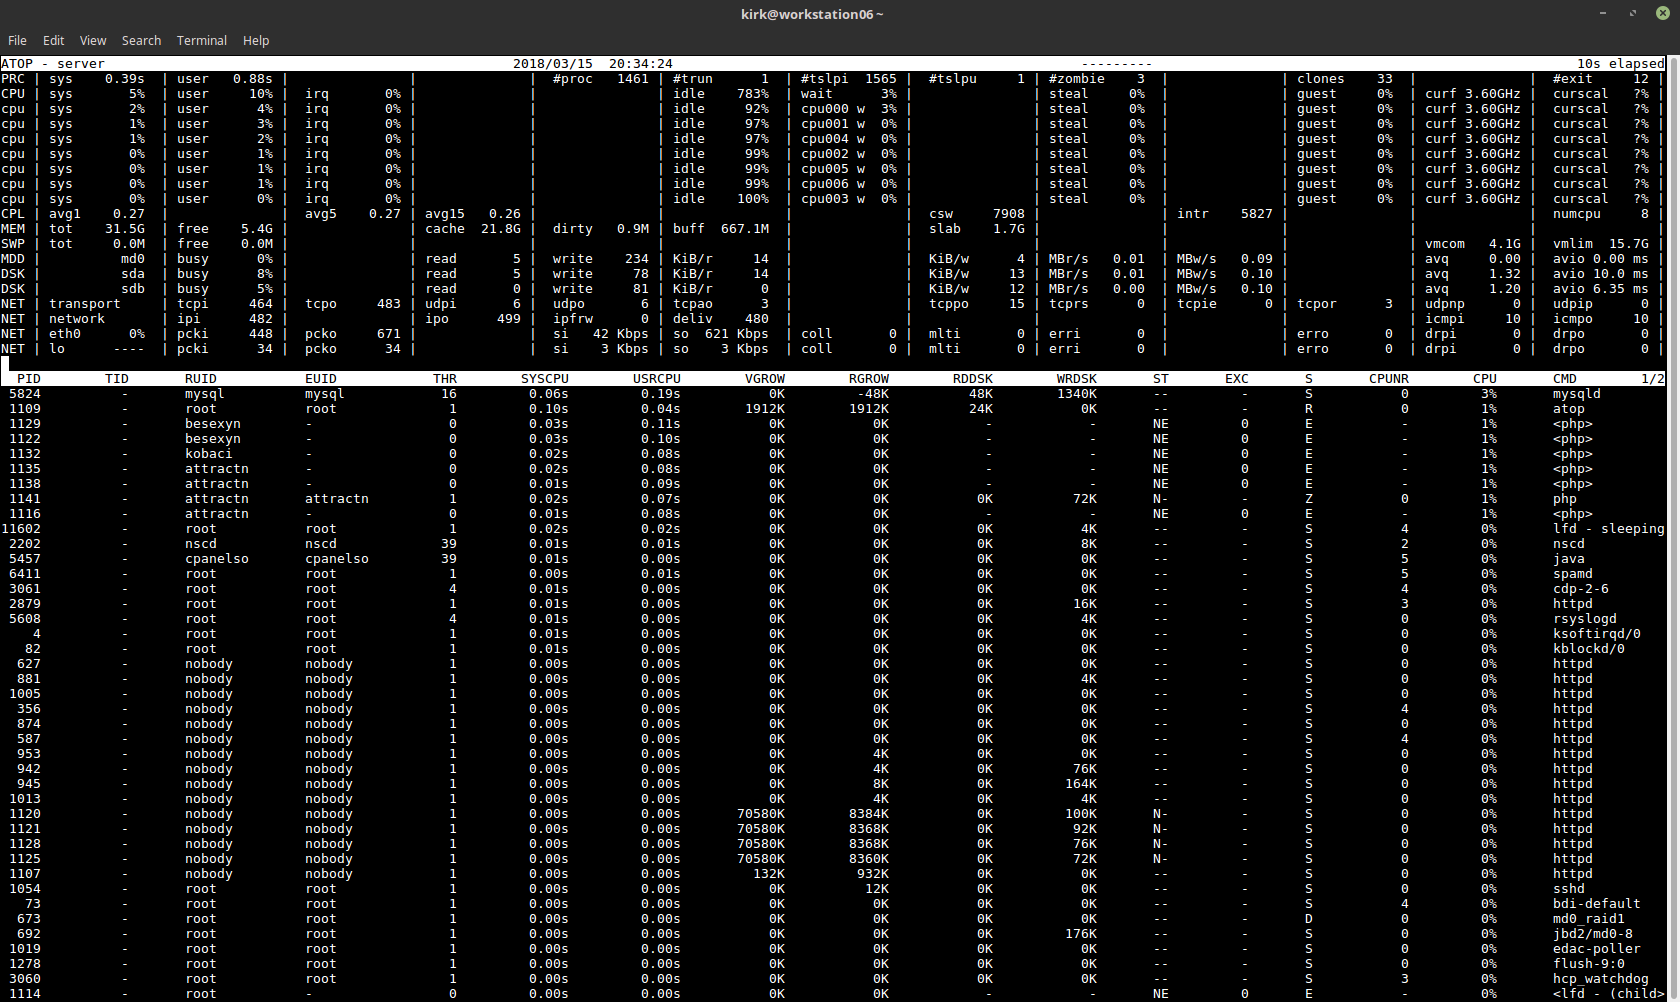 Atop provides a detailed breakdown of system resource usage such as:
- CPU usage, both overall and by process ID.
- System load average.
- Breakdown of memory usage, overall and by process ID.
- Disk I\O statistics per physical disk, as well as per LVM volume if you use LVM.
- Network usage statistics, broken down by network interface.
- A top-style process list breaking down programs running and sortable by resource usage.
Atop Service
Atop can also be run as a service on the machine. When running as a service, atop will record a snapshot of its statistics every few minutes and record the data to a log file. These log files can then be played back later using the atop utility to review the historic data. This can be incredibly useful in cases where the server is going down for an unknown reason. You can then go back to the historic atop logs and see if a program began consuming a lot of resources just before the server went down.
In order to launch Atop as a service and configure it to run at boot time, you can simply use the following commands:
chkconfig atop on

service atop start
Reviewing Historic Logs
By default, atop logs are stored in daily log files located in /var/log/atop/ with files rotated and renamed based on the date of the log.
To load a historic atop log and view its contents, you can simply open the log with “atop -r”, for example:
atop -r /var/log/atop/atop_20180315
Installing Atop
Atop is not included by default in most Linux distributions. You can check with your specific distribution resources to see where it is available for you.
On CentOS 7, the package is available in EPEL and can be installed in this way:
# Add the EPEL repository to your system

yum install epel-release

# Install the atop package

yum install atop
2. mysqltuner.pl
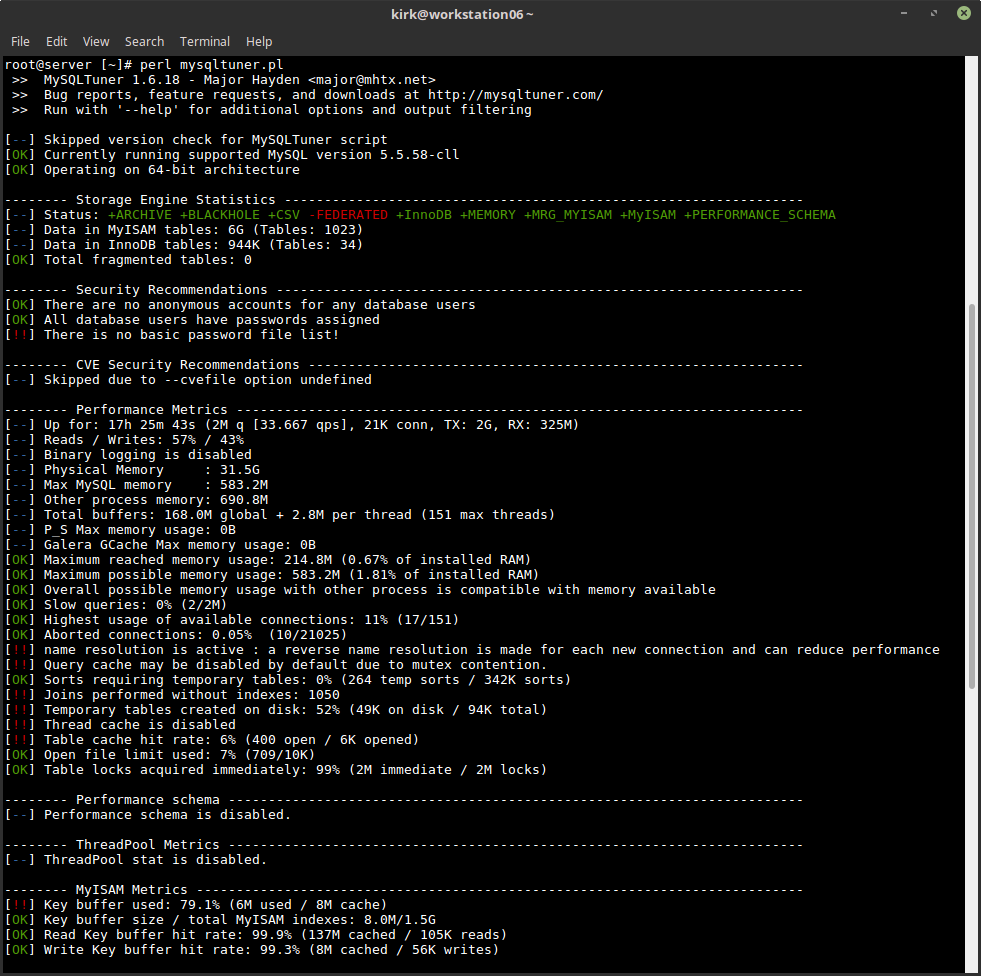
The “mysqltuner.pl” utility is a third party Perl script which provides fantastic insights into MySQL performance and tuning needs.
I have used this utility on many occasions to optimize poorly performing database servers in order to alleviate high load conditions without requiring hardware upgrades or even any changes to the usage pattern of the databases. Often, MySQL performance can be greatly improved by simply tweaking some basic options in the configuration.
Note: In order to get the best results from this tool, you should wait to run it if you have recently restarted MySQL. Some of the recommendations will not be accurate until MySQL has been running for some time (at least 24 hours) under normal activity.
A few examples of helpful information provided by the mysqltuner.pl utility include:
- Memory usage information (maximum reached memory usage, maximum possible memory usage given the configuration values)
- Statistics on amount of slow queries
- Statistics on server connection usage
- Statistics on table locks
- Statistics specific to MyISAM, such as key buffer usage and hit rate.
- Statistics specific to InnoDB, such as buffer pool use and efficiency.
Additionally, the tool provides recommendations for adjustments to common configuration options in the /etc/my.cnf configuration file. It may recommend adjustments to settings pertaining to things like the query cache size, temporary table size, InnoDB buffer pool size, and other settings.
As with any tool, it is important to exercise your experience as well as common sense when handling its recommendations. Some recommendations made by the tool could result in introducing instability to the MySQL server. For example, if your server is running low on memory already, increasing cache sizes dramatically can cause MySQL to exhaust the rest of your server’s available memory rapidly.
For this reason, I personally always go back and run the tool a second time after applying new settings, paying special attention to the statistic on maximum possible memory usage. That statistic will be accurate even when running MySQL immediately after a restart, although some other statistics provided by the tool may not be. The permissible range here can vary depending on the use case of your server. Safe values could be as high as 90% or higher on a dedicated MySQL server with very little other software running, but on a server with a lot of other programs running such as a cPanel server, allowing MySQL to use this much memory could exhaust the memory needed for other resources.
 Obtaining & Running This Tool
The mysqltuner.pl tool is not usually packaged with a Linux distribution or with MySQL. The creator provides it for download on Github. It can be obtained here. The creator also maintains a short link domain to the tool: https://mysqltuner.pl
Once you’ve downloaded the tool, you can execute it by running this command:
perl mysqltuner.pl
3. ss
ss is a command line utility which can be used to gain insights into network connections and open sockets on your server. The tool is included in the iproute2 package and is intended to be a substitute for netstat. It is also notably faster, compared to netstat.
A common use for ss is to check open TCP or UDP ports on the server. This can be useful for creating firewall rules or checking whether a service is really listening on the port you have configured it to listen on.
The commands to run for these types of uses would include:
 # Show listening TCP ports on the server

ss -lt

# Show listening UDP ports on the server

ss -lu
Another common use would be checking open connections to the server, which can be helpful for determining the connection volume or whether a connection is open between your server and another IP address.
The commands to run for these types of uses would include:
# Show open TCP connections

ss -t

# Show open UDP connections

ss -u
4. grep
Grep is a very helpful tool for “finding a needle in a haystack.” If you have a lot of text you need to sort through, such as log files or a folder full of configuration files, grep can greatly simplify the task.
A common use for grep is finding log data pertaining to some event, such as sifting through log data for Apache to find access attempts with a specific criteria. For example, if your Apache log file was stored in /var/log/httpd/access.log, you could use commands like these to find relevant log lines.
A few examples:
cat /var/log/httpd/access.log | grep “the text you are searching”

cat /var/log/httpd/access.log | grep index.html

cat /var/log/httpd/access.log | grep 127.0.0.1
Grep is also useful for sorting through the output of other commands, such as the “ss” command covered earlier.
For example, if you are looking for established TCP connections, you could run “ss -t” and pass it to grep like so:
ss -t | grep ESTAB
If you are looking for TCP connections to\from a specific IP, you can find that too!
ss -t | grep 127.0.0.1
A more advanced use of Grep is searching through files to find files containing a string of text. This can be useful if you are searching through multiple configuration files for a setting with a known value, but unknown location.
A few examples of searching folders with grep:
grep -r “text you want” /path/to/search/

grep -r “mysql” /home/user/public_html/
5. nc
Nc is a command line utility to establish connections to servers and interact with the service running on that port. It is an alternative tool to an older command line utility called Telnet. It is useful for testing connectivity and responses from services on a server.
You can use nc to see if a TCP connection is working, which can help in diagnosing service issues like a firewall blocking a port. The tool can connect to any TCP socket service, including protocols such as HTTP, XMPP, MySQL, or even Memcached.
In order to use the tool to interact with a specific service, beyond testing connectivity, you may need to know some specifics of the protocol so that you know what to “say” to the server in order to get a response.
Test Connectivity to HTTP
It is very simple to use nc to test an HTTP web server, you would run this command:
nc server.address.com 80
After connecting, you would use this command on the prompt to request a URL from the web server:
GET /
Test Connectivity to SMTP
Testing connectivity to an SMTP server is a slightly more advanced process, but still very straight forward. Sometimes, these steps are recommended by email blacklist RBL’s to test connectivity to a mail server and check any errors that are encountered.
To connect to an SMTP server, you would use this command:
nc server.address.com 25
Once connected, you can use these SMTP commands to send a test email.
MAIL FROM:[email protected]

RCPT TO:[email protected]

Type email message data

.

QUIT
SSL Alternative
Nc is not designed to connect to services that are SSL enabled. If you are using an SSL service, it is better to use the OpenSSL command line utility. Other than the commands to connect, the process is the same.
The basic command format is: openssl s_client -connect server.address.com:port
So, to connect to an HTTPS server, you could run the following command:
openssl s_client -connect website.com:443
Once the client is connected, you can run protocol commands in exactly the same manner as with nc. This way you can perform the same tests or commands to the SSL enabled service.
Conclusion
While no short blog post can comprehensively cover all of the tools needed in the day to day life of a Linux Administrator, and in fact many of the very common well-known tools are not covered here, hopefully, these insights provoked some new thought and these simple tools will send you down a path toward discovering more in-depth information about your Linux system.
Sound like a hassle? Let us manage your systems.